An Analytic Dive Into Kobe Bryant's Career

Basketball has been a part of my life for as long as I can remember, and it's a sport that I'm incredibly passionate about. I love the way it brings people together and the skills and traits that it develops. From leadership to teamwork, and from winning to the exhilaration of dunking and shooting threes, there's nothing about the game that I don't enjoy - except maybe all the running!
Playing basketball has been instrumental in my personal growth. I've learned the importance of discipline, perseverance, and determination. The game has taught me how to set goals, work hard, and push through challenges. Through the ups and downs of the game. I've also learned how to work with others, communicate effectively, and trust my teammates. I have been able to carry these skills with myself off the court.
Due to a sustained amount of injuries, I was unable to continue pursuing the game. Through my new found passion for data analytics, I would like to take this opportunity to analyze the career of Kobe Bryant, a player who left an indelible mark on my journey.
Kobe Bryant is a legendary figure in basketball history, and his impact on the sport is undeniable. By diving into this data, we can also trace the evolution of Kobe's career and identify key moments that defined his legacy.


Data Source

The primary dataset includes a comprehensive record of Kobe Bryant's NBA career, containing game-logs for both regular season and playoffs. The data was obtained by scraping two websites, BasketballReference and stats.nba.com, using Python and R programming languages.As a secondary source I took a dataset from Kaggle to support one of my questions which consisted of Kobe Bryant shot location data. In Python, the BeautifulSoup library was employed to extract relevant data from HTML pages, while the httr library was used in R to achieve data based on his shot location. By utilizing these libraries, the data was obtained in an efficient and streamlined manner.
Kobes career log CSV that I managed to get off basketball reference consisted of the columns below that I will be using throughout the analysis:
G - Season Game
Age - Player's age on February 1 of the season
Tm - Team
Opp - Opponent
GS - Games Started
MP - Minutes Played
FG --Field Goals
FGA - Field Goal Attempts
FG% - Field Goal Percentage
3P -3-Point Field Goals
3PA - 3-Point Field Goal Attempts
3P% - 3-Point Field Goal Percentage
FT - Free Throws
FTA - Free Throw Attempts
FT% - Free Throw Percentage
ORB - Offensive Rebounds
DRB - Defensive Rebounds
TRB - Total Rebounds
AST - Assists
STL - Steals
BLK - Blocks
TOV - Turnovers
PF - Personal Fouls
PTS - Points
GmSc - Game Score
+/- : Difference in the score when the player enters the game and subtracting it from the score when the player exits the game.
The dataset from stats.nba.com contains more information Kobes shot type(eg. 3pt or 2pt field goal), action type(jumpshot,layup,dunk), shot zone (Mid-Range,Restricted Area,Above the break),shot made or missed and most importantly for the use of the shot chart later the location of the jumpshots taken.
Methods
Cleaning and wrangling of the data was done on Tableau Prep and also with the use of pandas library on python using jupyter notebook. The visualizations for this project were primarily created using a combination of tableau and python library matplotlib. Tableau proved to be a useful tool in incorporating interactive visuals that were crucial for presenting the analysis effectively. Additionally, Tableau's features for working with aggregations and filtering allowed for a more efficient exploration of the data. Python was also utilized for more complex data manipulations and was used for creating my shot chart. Overall, the use of both Tableau and Python provided a comprehensive and insightful representation of the data.
Now, lets get into the questions that I will be asking.
1. How well of a distributor was Kobe based on assists and turnovers?
2. What were some of Kobes best performances against your favourite team?
3. 8 vs 24, which career was better?
4. What was Kobe Bryant's shooting accuracy like during his 2007-2008 MVP season compared to his overall career?
5. How much did Kobe step up in the playoffs compared to regular season?
Lets see if we can visualize a bit of Kobe's career!
How well of a distributor was Kobe based on assists and turnovers?

Kobe was not known to be a distributor he was known for his ball dominance and I wanted to look at his average assists throughout his career and also take account of his turnovers of that same season. The reason I wanted to take account for his turnovers are just to see visualize what his assist/turnover ratio looks like to provides insight into his abilities as a playmaker and ball handler. With out dataset this was not to over complicated to find because it already had his aggregated assists and turnovers all that need to be done was to average them out for every season.

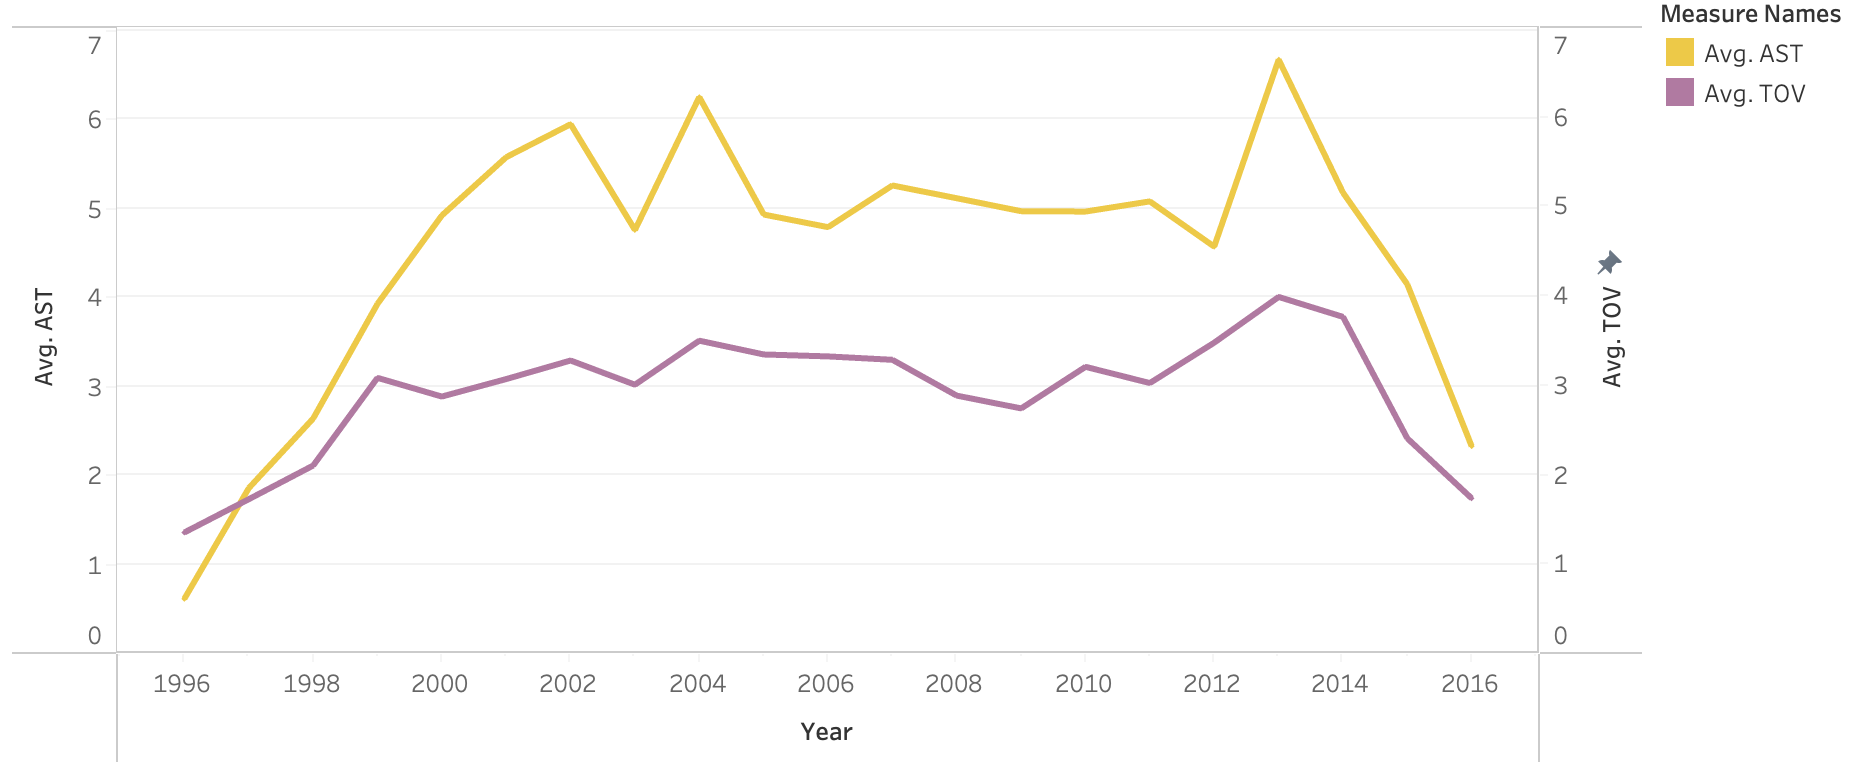
From 2000 to 2014, Kobe's average of 5 assists per game remained consistently strong, demonstrating his ability to create scoring opportunities for his teammates. In fact, in 2014, he had his highest average of 6.6 assists per game, showcasing his development as a playmaker over time.
His turnover average stayed relatively decent and hovered close to 3 a game throughout his career. Interestingly, we can also see a correlation between Kobe's assist and turnover statistics. As his turnover numbers increased, so too did his number of assists, which is understandable but because the more you have the ball in your hand the more likely you are prone to turning the ball over.
In order investigate Kobes ability as a playmaker further, I wanted to look at the most Double-Double and Triple Doubles he has over the course of his 20 seasons. For the readers not familiar a double double in basketball occurs when a player collects ten or more in two different categories, including points, rebounds, steals, assists, and blocked shots. Simply a triple double is when you obtain 10 or more in three categories. For the purposes of analyzing Kobe as a passer I only collected the triple doubles and double doubles per season where he at least obtained 10 assists regardless of the other statistic categories.
For me to find his double-double games and his triple double games I used a measure that filtered out the games where he had to have a more than 10 assist with combination of any other category that is greater than 10 as well.

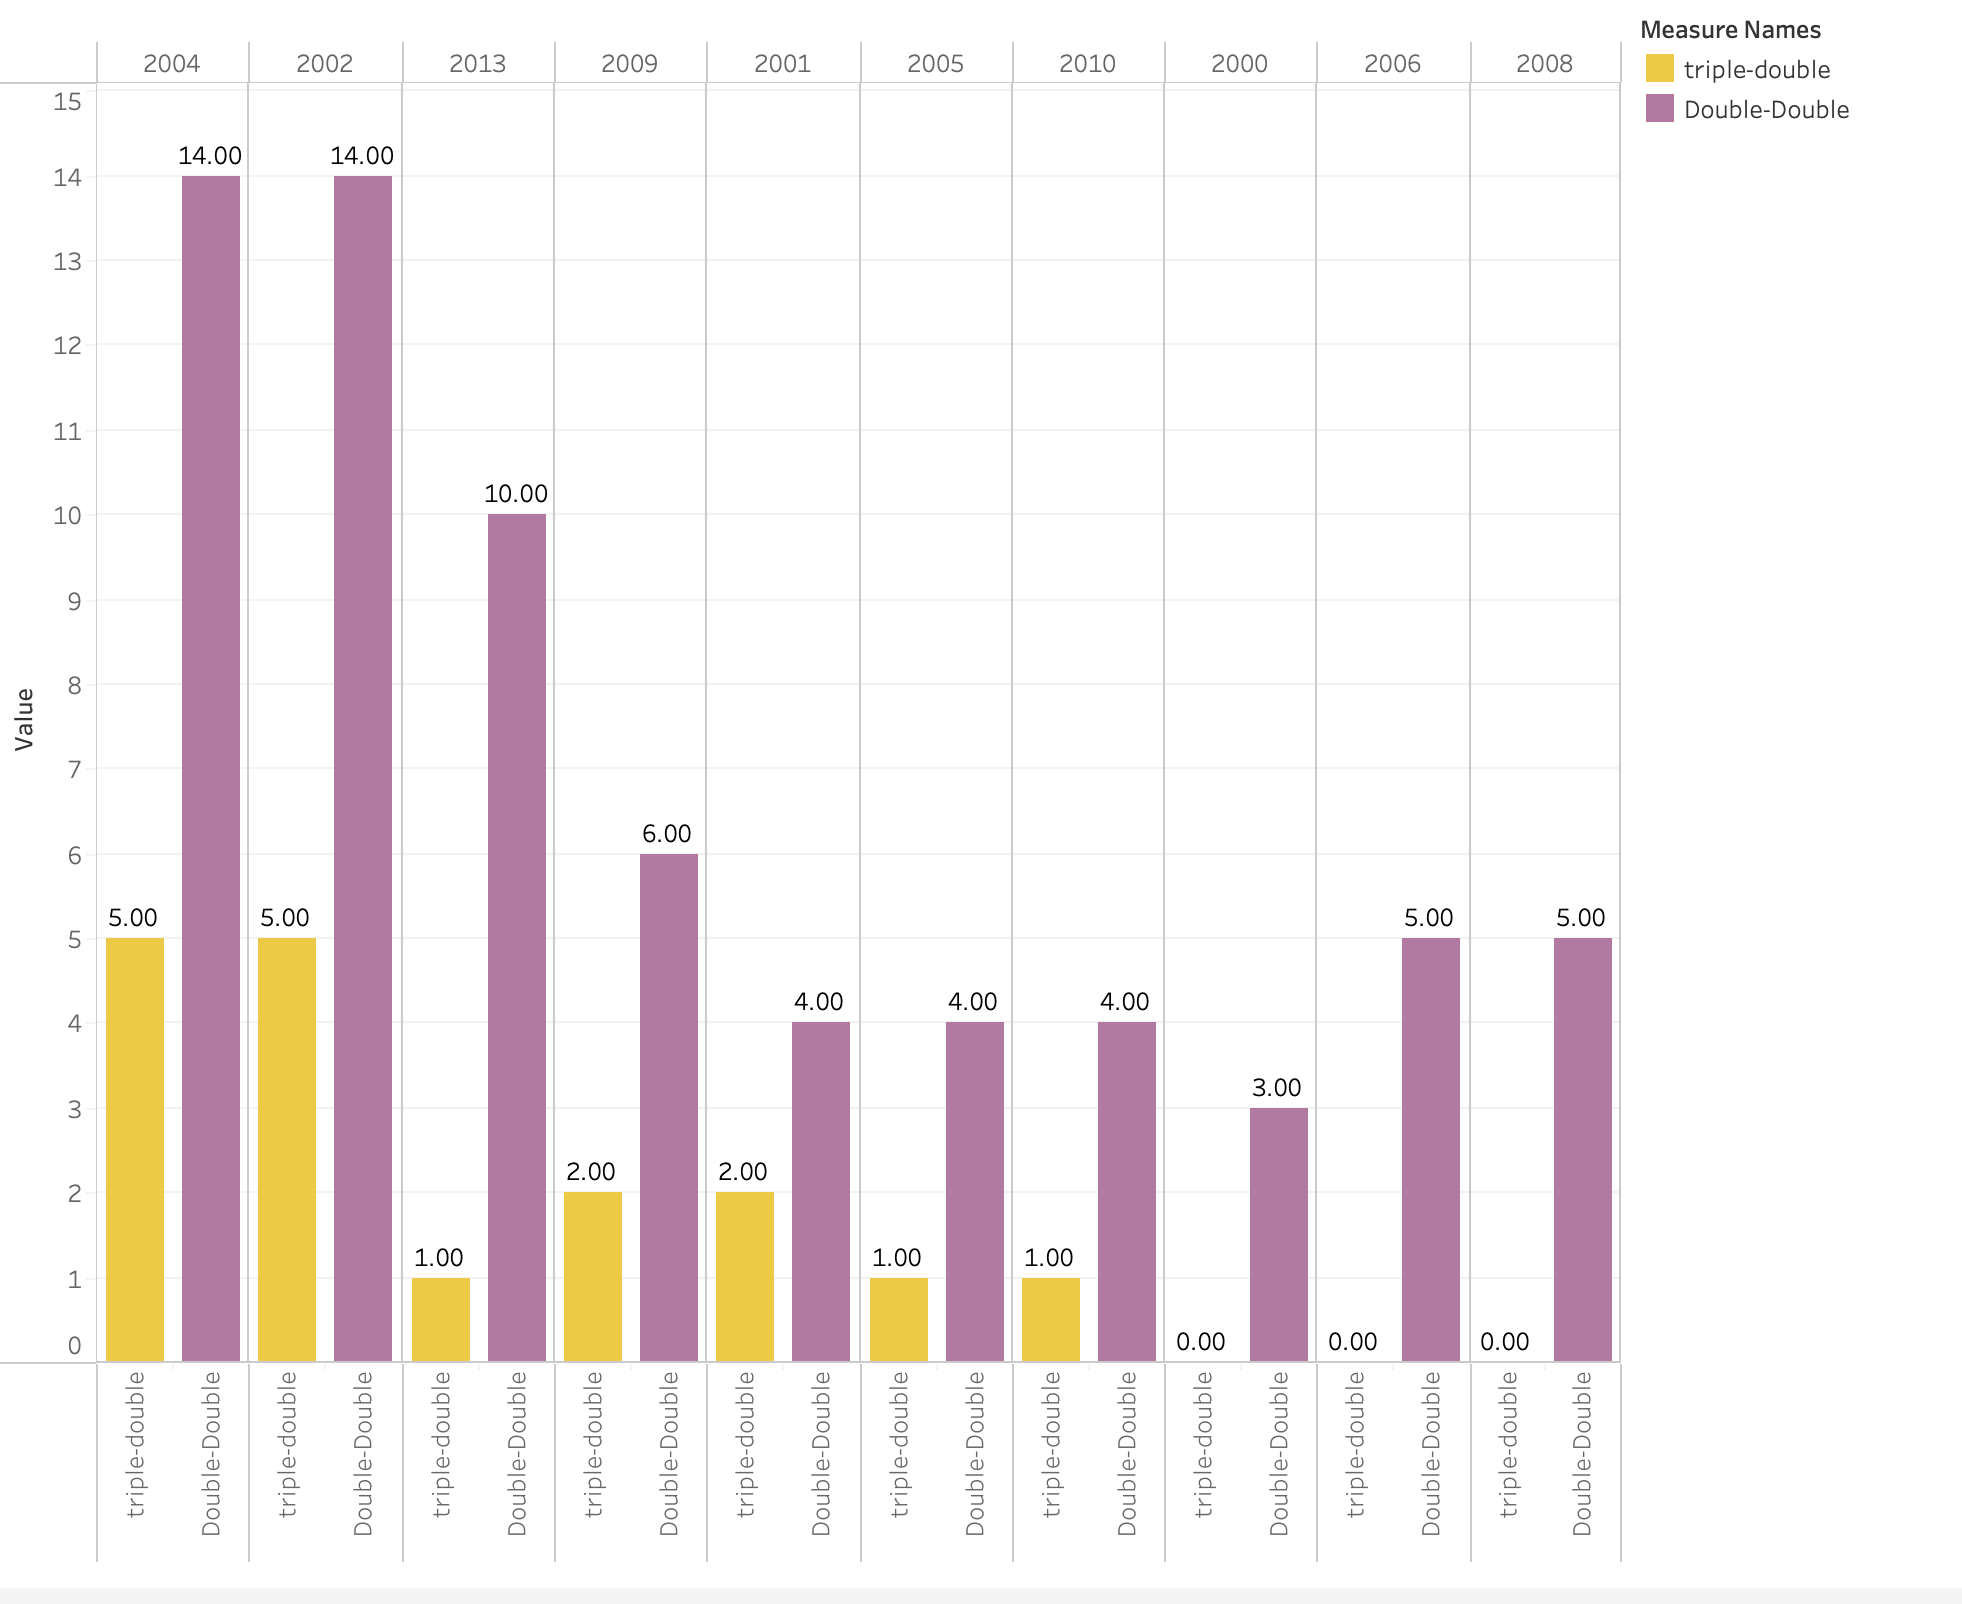
From our chart above see that the most double-doubles Kobe had in his career were 14 which were both in his 2004 and 2002 season. He definitely obtained more double-doubles in his career than triple doubles. In total we see that Kobe obtained 69 double doubles with just assists throughout his career which may be a lot more than people assume considering he is known to be just a scorer. Overall, we can conclude that Kobe was an underrated distributor through his career, although he definitely is more of a scorer we can't underestimate his ability on getting his teammates involved.
What were some of Kobes best performances against your favourite team?
Kobe Bryant's legacy as one of the greatest basketball players of all time is often associated with his memorable performances against every NBA team during his illustrious career. As a basketball fan, I'm curious to learn more about his best performance each season against every team in the league. By examining his performances in this way, we can gain a deeper appreciation for his skill, competitiveness, and impact on the game of basketball.
By utilizing a dashboard as a visual representation, we can gain valuable insights into various aspects of Kobe's performance. With the ability to interact with the dashboard, we can easily click on any logo and view key statistics such as the maximum points, assists, and field goal attempts for each year. This provides a more comprehensive view of Kobe's performance over time.
Additionally, the dashboard allows us to see Kobe's total wins and losses against each team. This information can be used to gauge his overall success as a player and sheds light on his ability to consistently win games. Overall, the use of a dashboard offers a more interactive and insightful approach to analyzing Kobe's performance.
A lot had changed between 1996-2016, one of them being some franchise team names. In order to deal with this I just created groups in Tableau of the teams that experience name changes and just grouped them under the current name of the franchise. For example the current day Memphis Grizzlies use to be called the Vancouver Grizzlies and I just grouped these two teams together and that way all the games against Vancouver grizzlies would show up under the Memphis Grizzlies logo.
Cool thing about this is we can gain some insight on which team did Kobe have the most success against also which teams he may have struggled with throughout his career. One this I noticed is that he does not have too many losing records against most of the opposing NBA teams besides the Spurs,Portland and Miami.
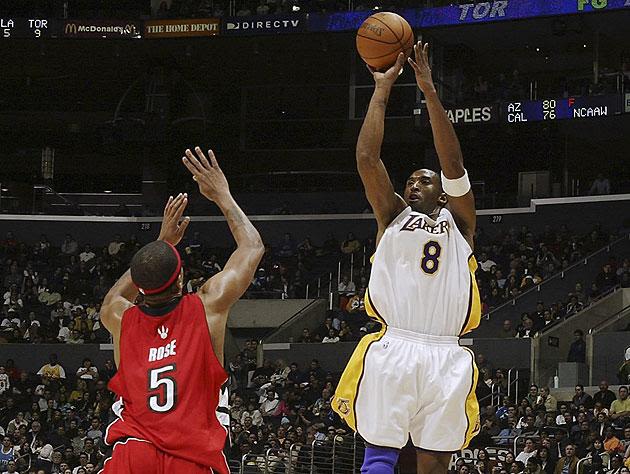
In order for my too the most stats Kobe had against my favourite team which without bias happens to be the Lakers, I had to chose my second favourite team our very own the Toronto Raptors. Turns out Kobe really liked playing against Canadas only NBA team where he averaged a whopping 27 ppg, 4.3 assists and a solid field goal percentage of 45.92%. Of course who can forget the historical 81 point game performance the most points he ever scored in a game and the second most points scored in one game in NBA history.

8 vs 24, which career was better?

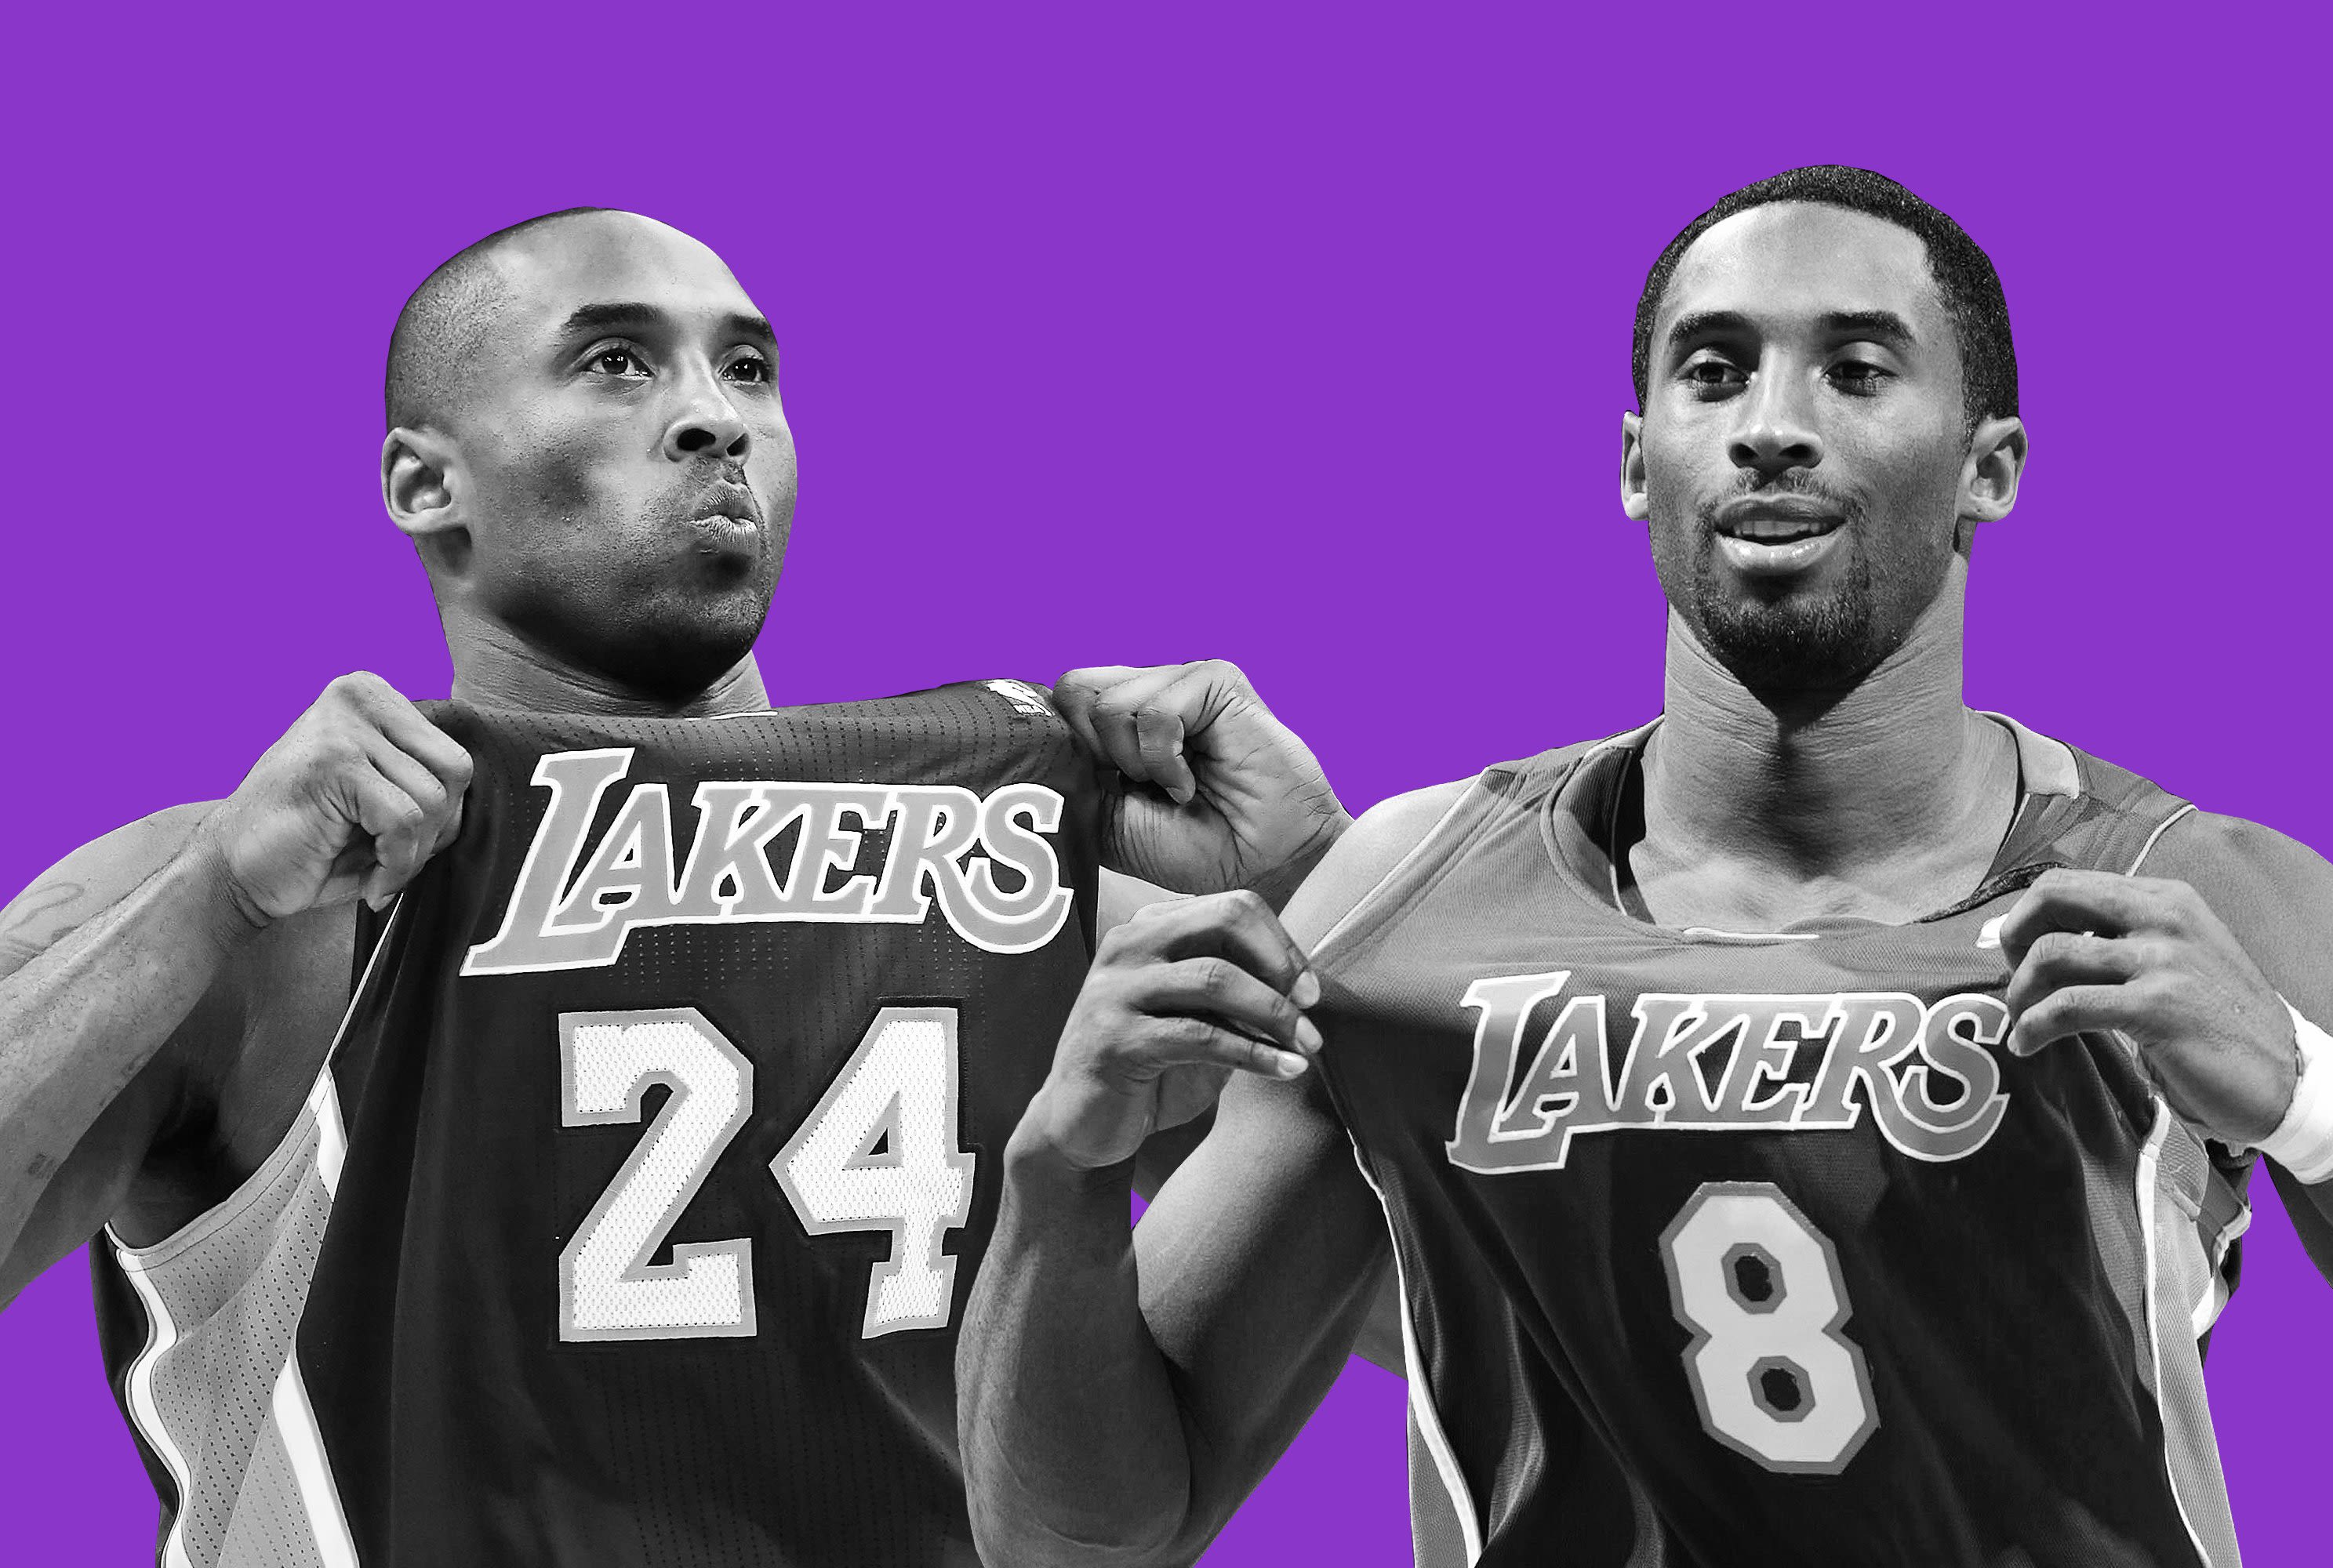
Before the 2006-2007, Kobe Bryant surprised the world and changed his number from 8 to 24. His reasoning for the number change was like a new beginning for him, essentially a new chapter in his story. I wanted to compare Kobes second act and see how it pairs up to the first half of his career as number 8.
To address this question, I chose to develop a Tableau dashboard that features a symmetrical layout allowing for a side-by-side comparison of Kobe's statistics. This approach enabled me to effectively analyze and compare his performance metrics through average PTS, FGA, FG, FT, TRB and more stats that we can observe below.
One of the important tasks that I needed to do was to ensure that I filtered out the statistics only from the seasons in which the player wore the numbers 8 and 24.
To clarify some of the basketball lingo with the line graph on the bottom part of the visual I am comparing Kobes avg (+/-) and avg gmsc. We have a nice glossary from basketball-reference to help give us a nice explanation for these terms which I will also share below.
Gmsc, gives us a rough measure of a player's productivity for a single game. The scale is similar to that of points scored.
(+/-), tell us the net changes in the score when a given player is either on or off the court.
Its honestly amazing to see how neck and neck it is between between the two numbers. I would honestly have to say that based on the stats from the dashboard that they are the equal yes a tie! The averaged very similar numbers and wearing number 8 Kobe won 3 championships 8 all-stars compared to when he was 24 Kobe won another 2 championships,2 final mvps and 10 all-stars.
There is a point where we can see near the end of Kobe's career that his gmsc and plus minus rating started to dip but honestly I would not hold that against him because he was dealing with injuries and father time was catching up to him.

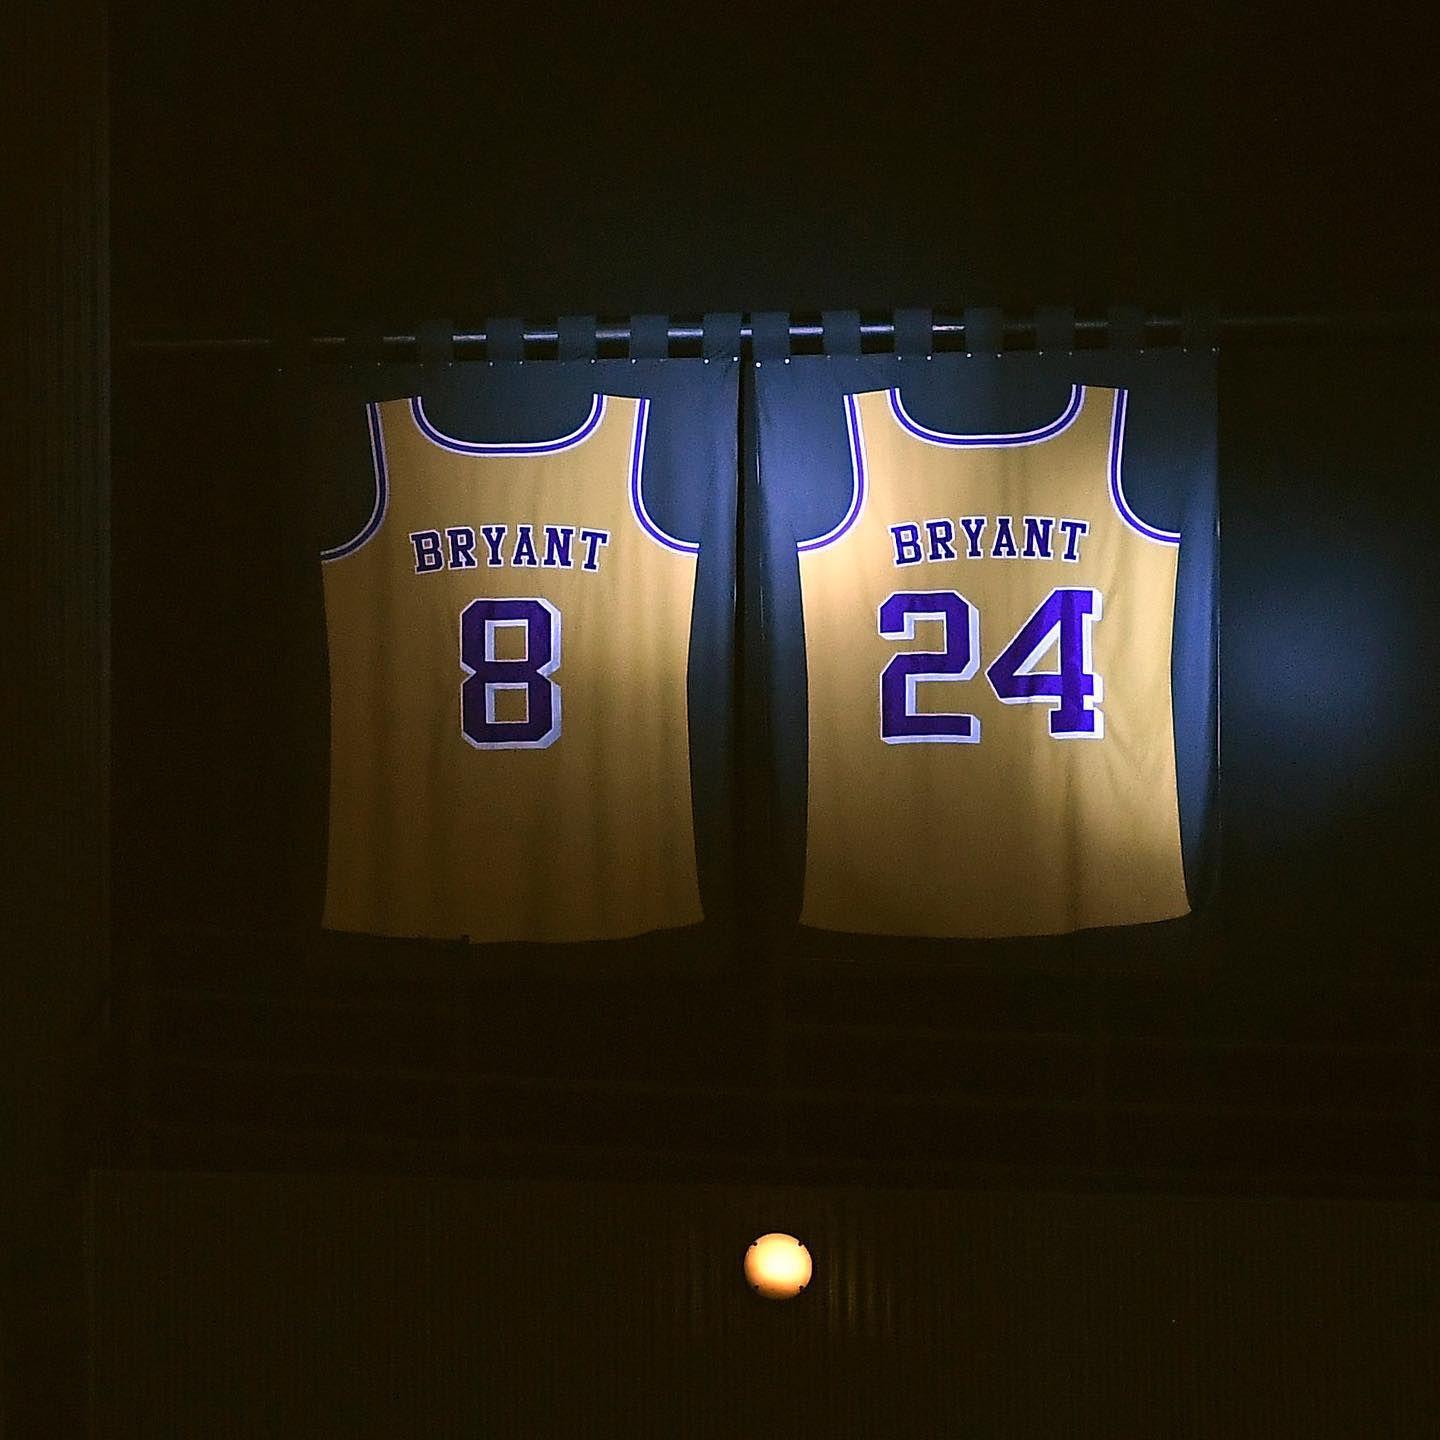
Only player in NBA history to have 2 numbers retired for the same team
Only player in NBA history to have 2 numbers retired for the same team
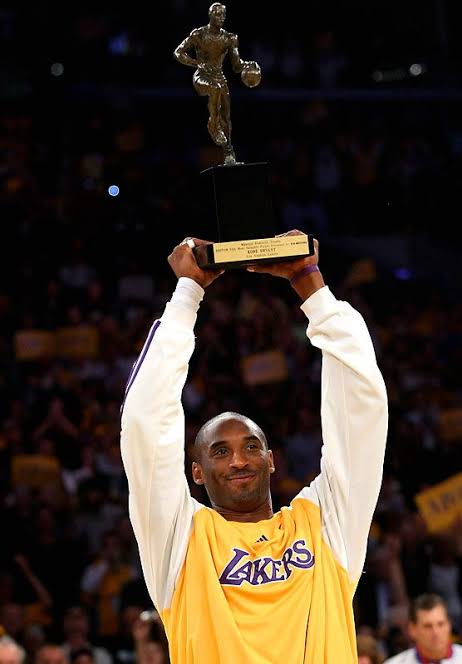
What was Kobe Bryant's shooting accuracy like during his 2007-2008 MVP season compared to his overall career?

During Kobe's career he graced a single MVP award in the 2007-2008 NBA season. In order to gain a deeper understanding of Bryant's performance that season, I wanted to analyze his shot accuracy and compare it to his shots from other seasons. By doing so, I could identify which areas of the floor he excelled in and determine how his shooting may have contributed to his success during that MVP season.

Below I have a created a shot chart visualizing Kobes missed and made shot attempts throughout his career which was used from my secondary data source from kaggle. This below visualization below was used creating matplotlib library in python. I really had challenges with making this shot chart in Tableau, unfortunately Tableau just was not able to get the coordinates of the shot locations on the background image where as on matplotlib was able to simply do a much better job.

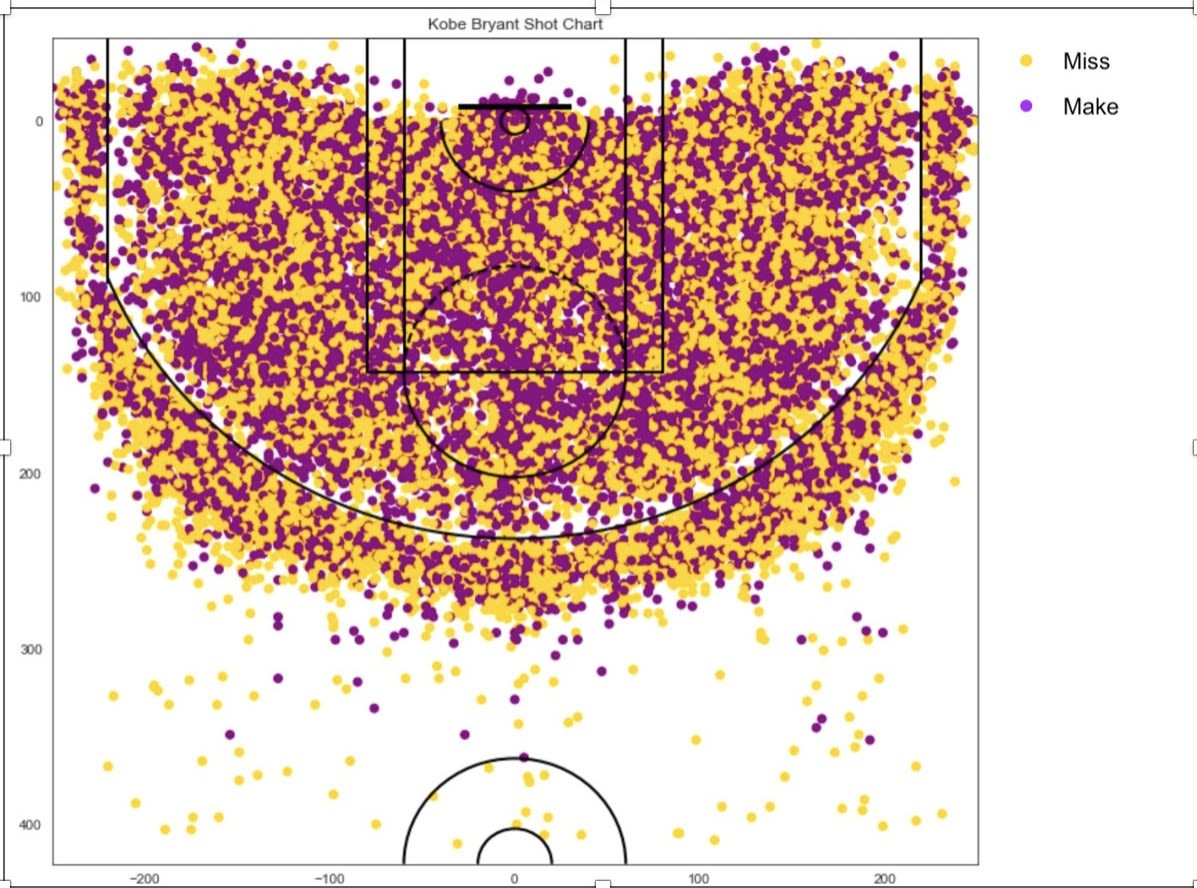
From my scraped primary data set from stats.nba.com, I was able to use the zone area to look find the shot accuracy by dividing the shots made by shots attempted . Below we get Kobes shot accuracy based on the shot zone throughout his career and we can see the different zones on our legend below. These were also constructed through the use of matplotlib.

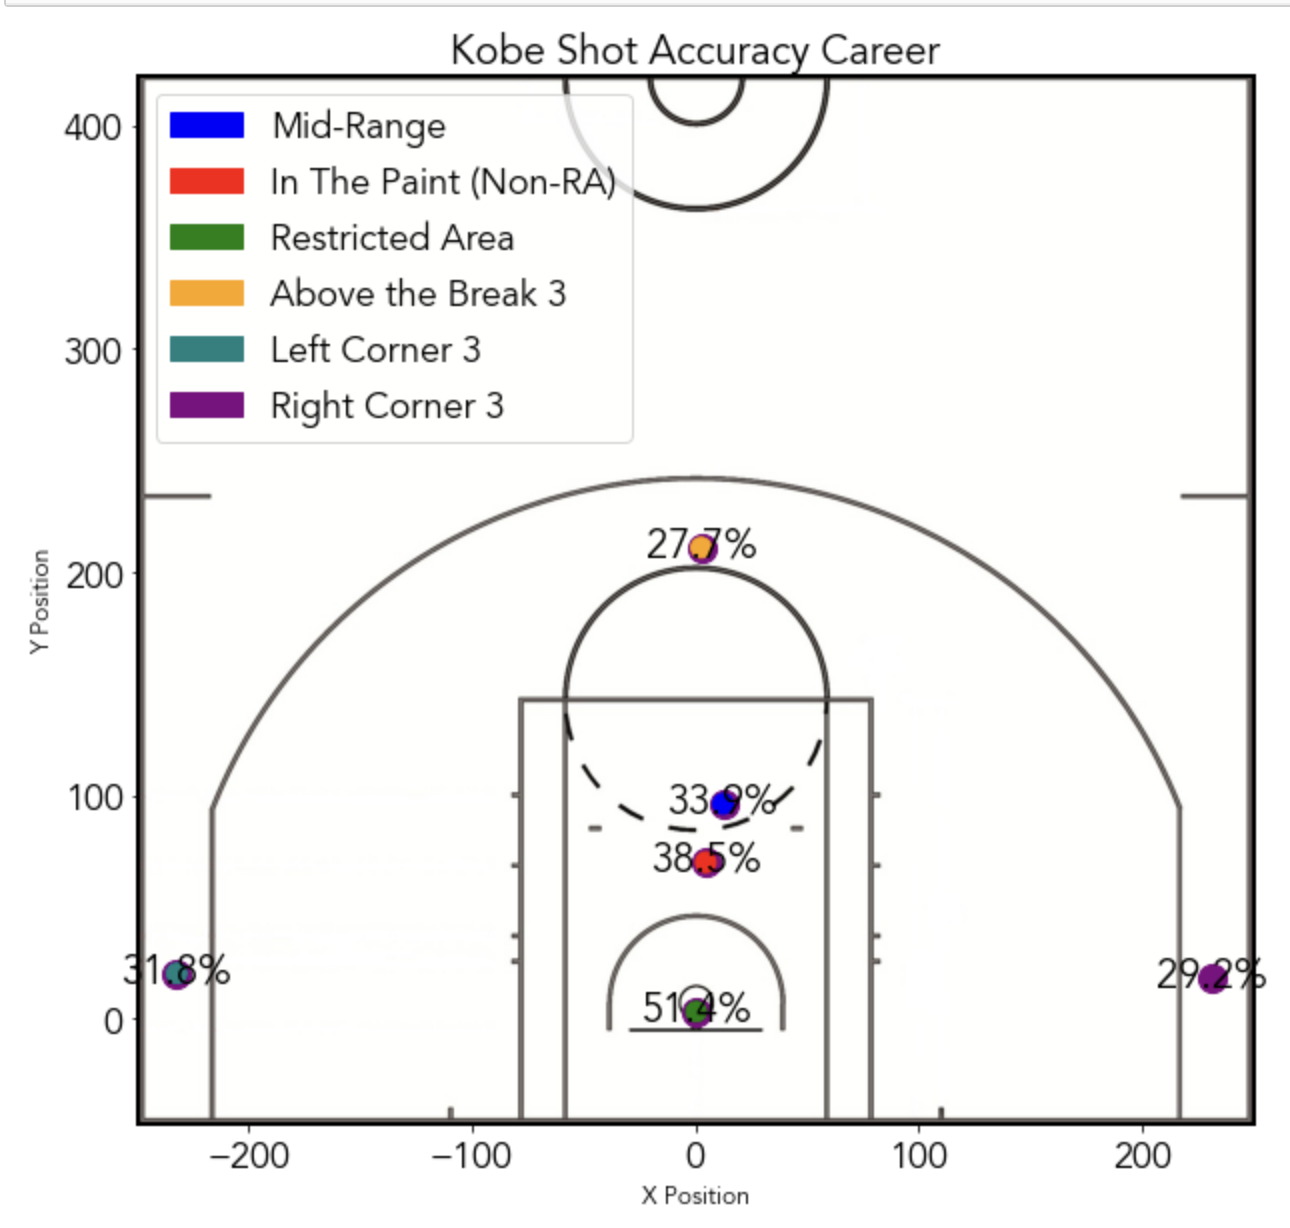
I filtered the data set to look at just Kobes MVP season and get the shot accuracy too see any significant differences for him during the 2007-2008 NBA season.
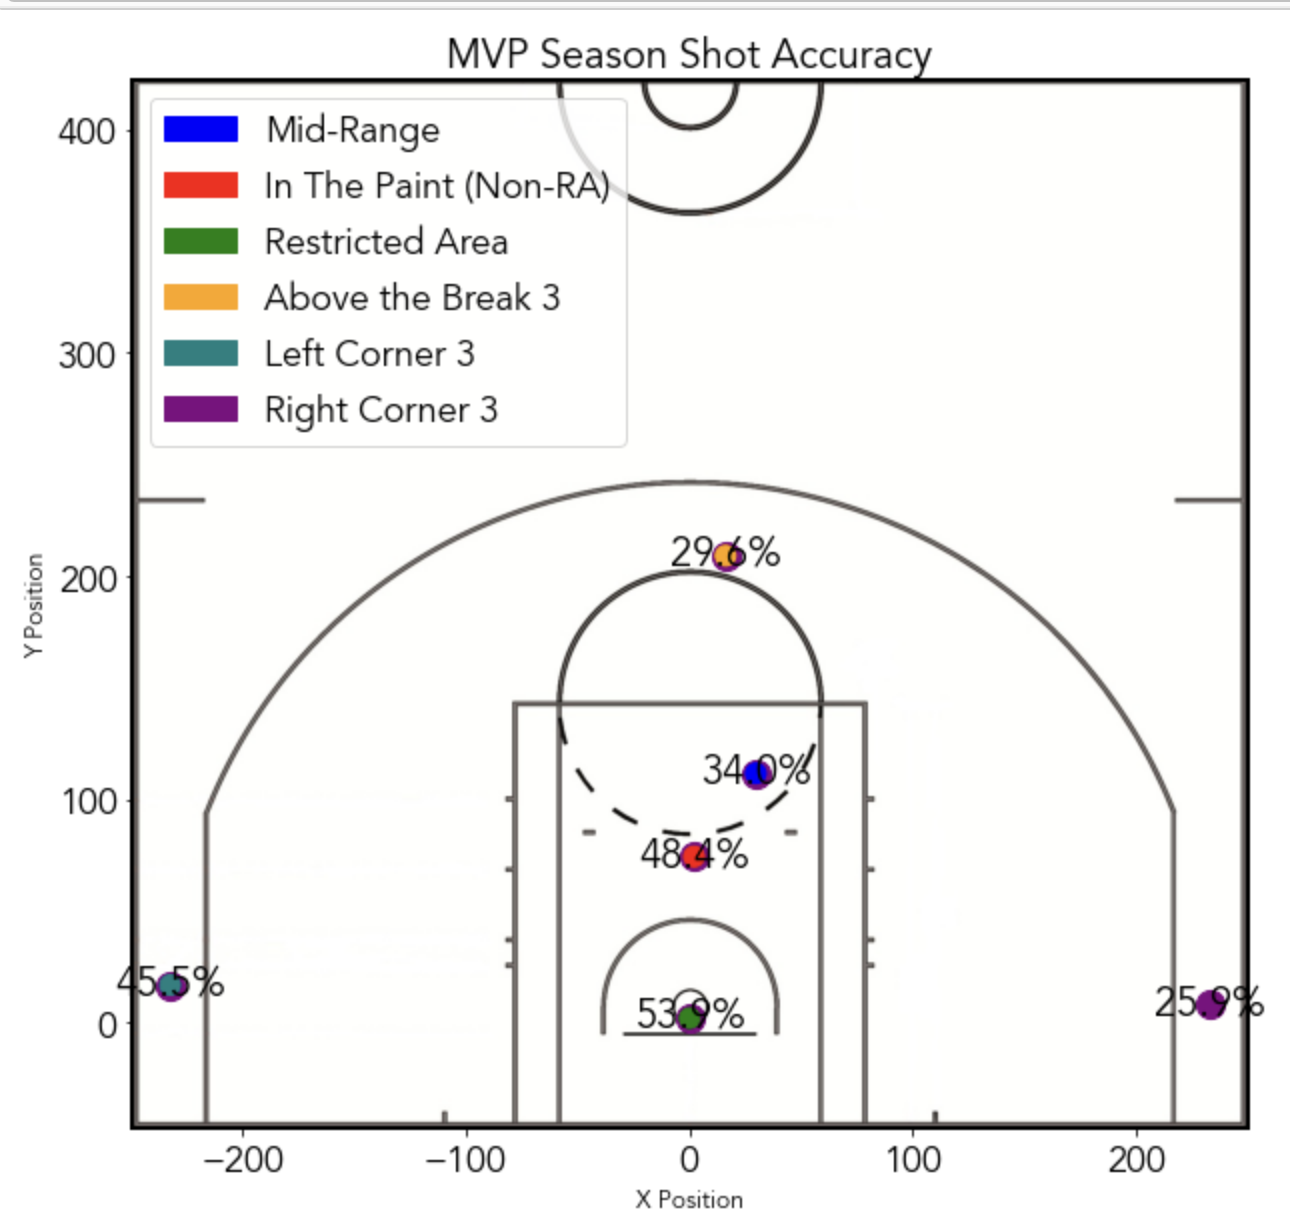
We can see that Kobes shot accuracy drastically increased from the left corner 3 where we saw a jump up from 31% to 45%! His shot accuracy increased from every zone only in the right corner we saw his accuracy decrease down to 25.9% compared to how he usually shoots at around 29%.
To no surprise we can see that Kobes shooting accuracy was better overall during his MVP season but also we can see that throughout his career his shot accuracy from all over the floor was consistent. For future exploration I would love to look at whether Kobe was deserving of more MVPs than just the single one he earned in his entire 20 year career.
How much did Kobe step up in the playoffs compared to regular season?
Kobe Bryant and championships have pretty much been synonymous. He is known for always stepping up in the playoffs and my goal with this question is to compare his stats from his regular season and playoff numbers. I chose to accomplish these visualizations in Tableau. First I wanted to compare Kobes average points per game in the regular season and compare that to his playoffs ppg averages just looking at just the years that he played in the playoffs and regular season.

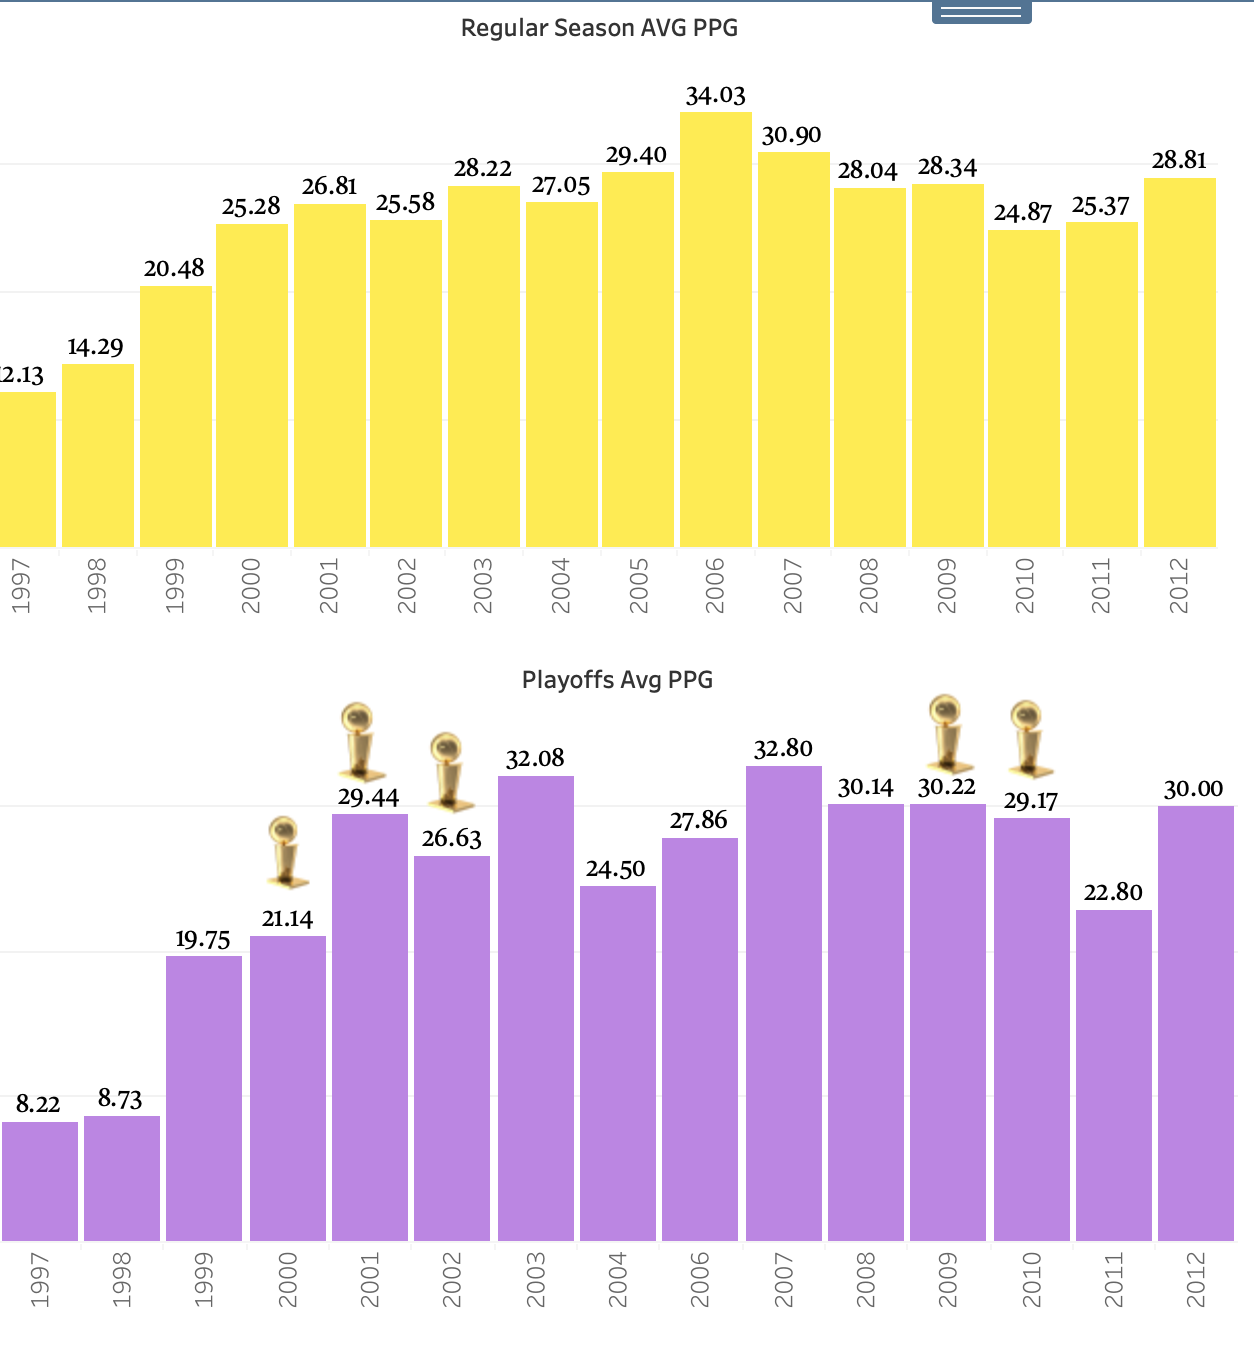
From our visual above we can see that overall Kobe has consistently stepped up in the playoffs time and time again. The years that he won the NBA championship which are denoted with the trophies, we can see that for every single championship except his first one Kobe always increased in points especially during his last run in 2010 where he jumped his seasonal average from 24.17 ppg to 29.17 ppg, and indeed he was always an essential part of every single championship that he won.
I also was interested in see how Kobes 3 point game changed when it came to playoff-time.

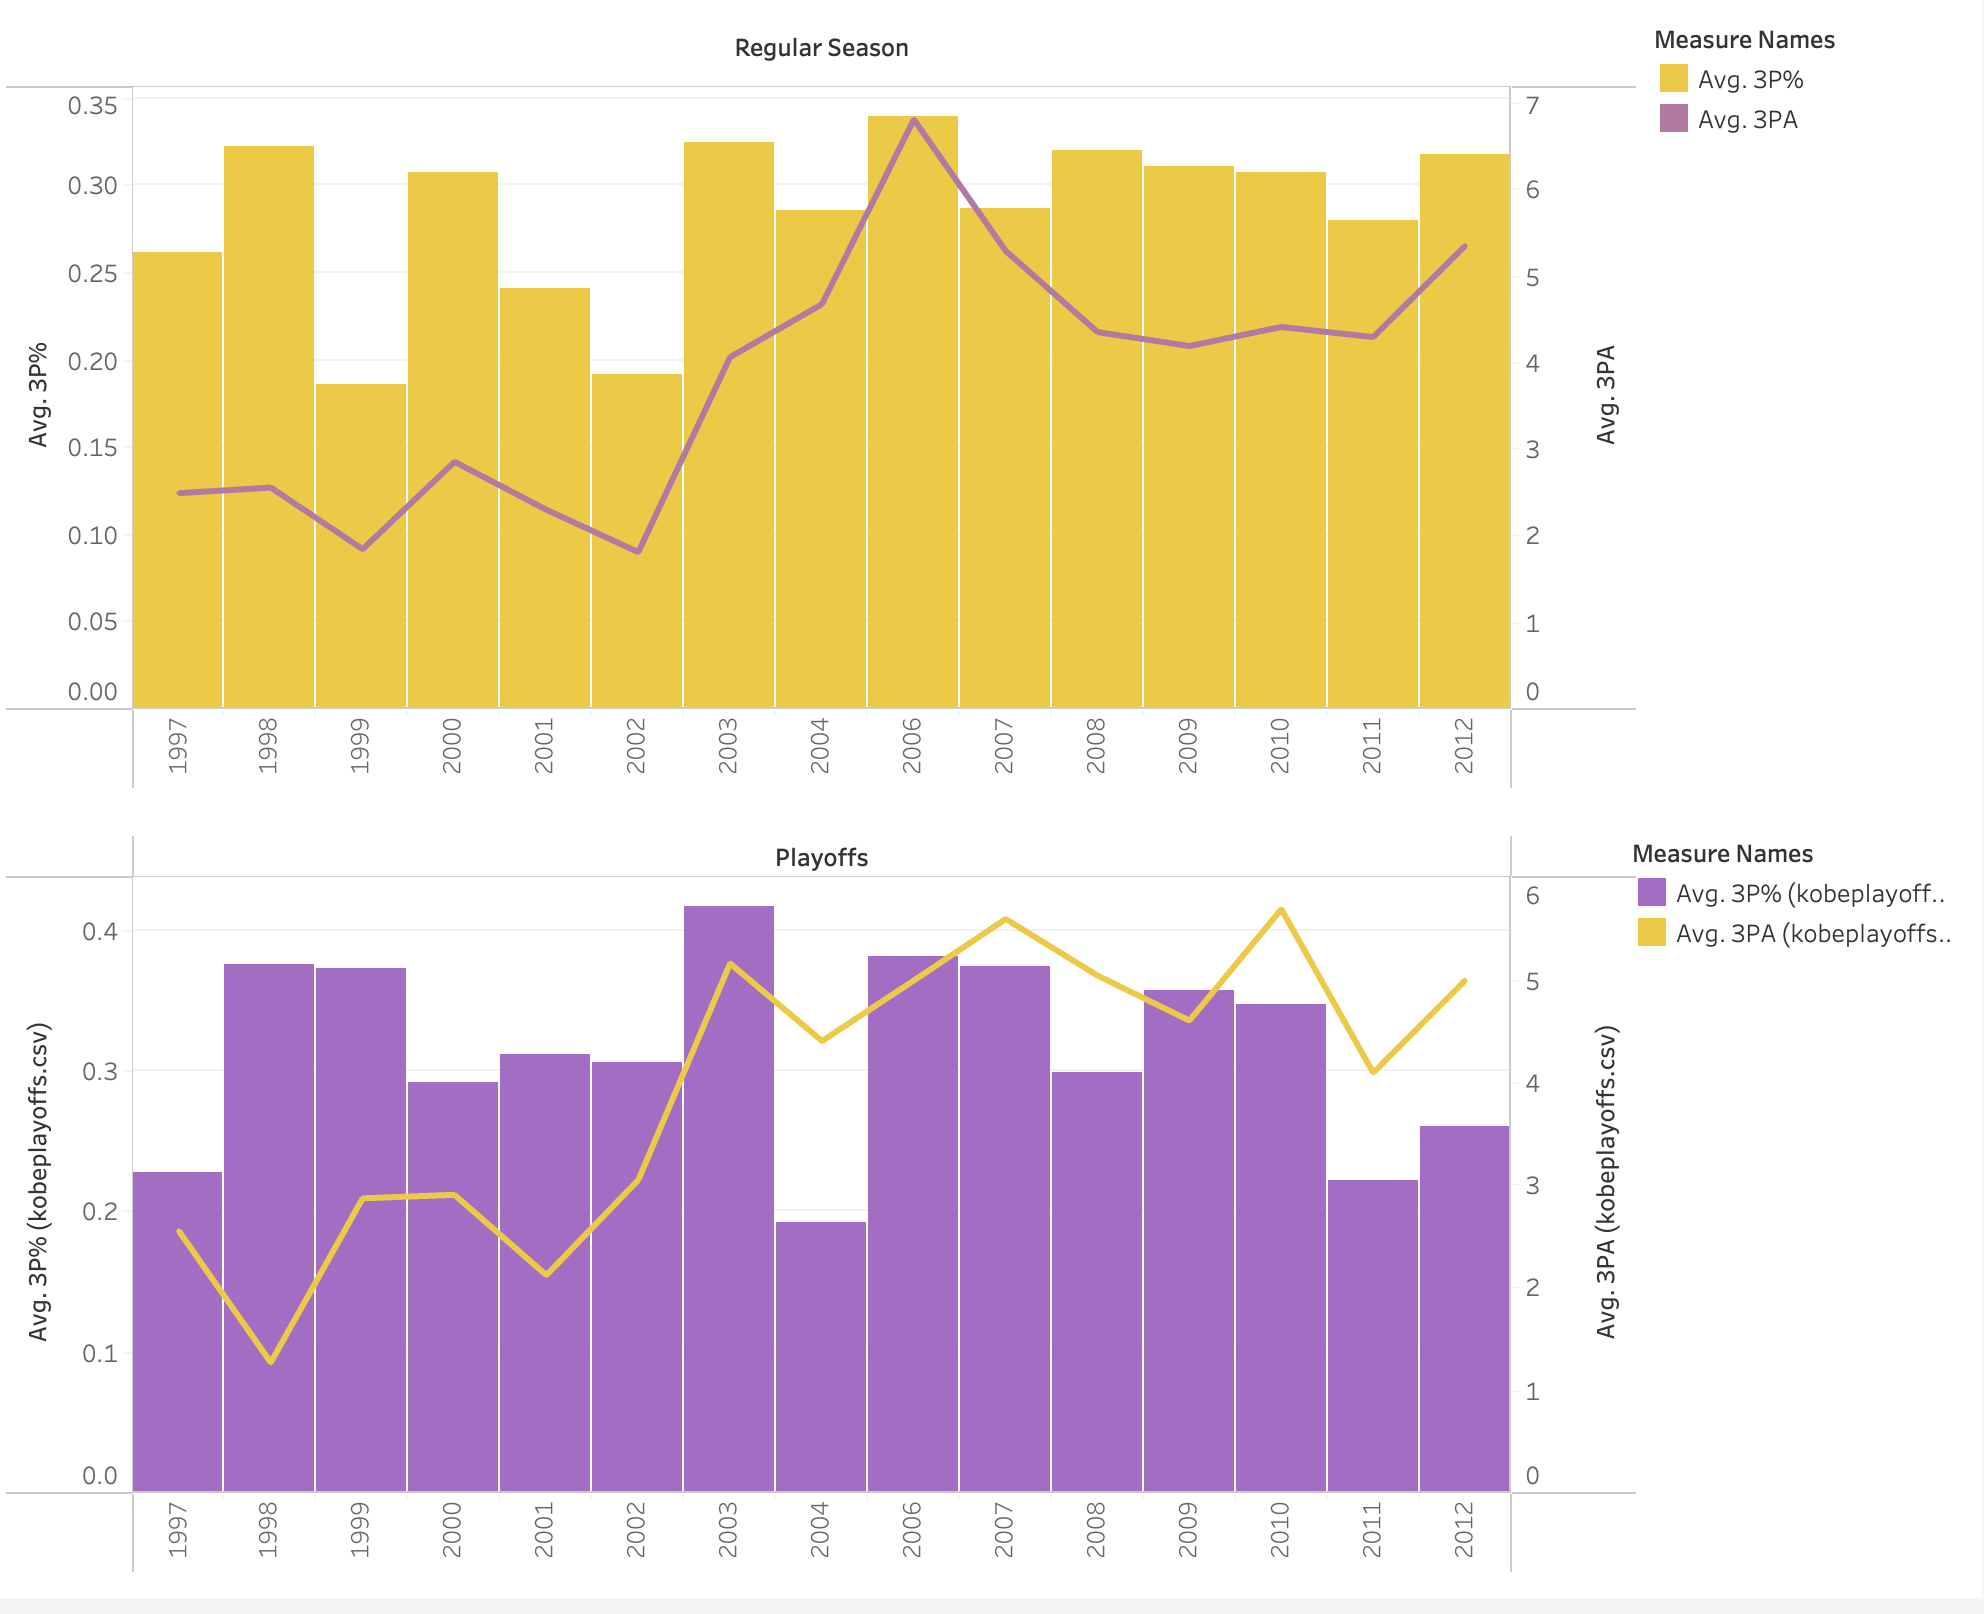
From the graphs above we can see that Kobe 3 point percentage and attempts do not seem to be as consistent in certain parts of his playoff performances. Most noticeably during the 2004, 1999 season we see him take a huge drop in 3 point percentage in the playoffs as well as in the 2011, 2012 he did not shoot the ball on par with how he was in during regular season.
Seeing the 3 points attempts slowly increasing in the later part of his playoff runs tells an interest story of how possibly the game in the NBA has become more of a 3 point game and we can see Kobe adjusting to play in that style comparing to some of his earlier playoff performances.
Conclusions
Overall we can see that Kobe a super impactful career. If there is one thing that we all can agree on is that he consistently played at a high-level through-out his 20 year NBA career.He was a multi-dimensional player.Both 8 and 24 were hall of fame worthy careers, he stepped up in the playoffs when his team needed him the most.We also got a chance to see how he has played against every single team in the NBA. There is still so much I am hoping to explore but we will save that for another day! I hope you guys also got a chance to know a bit more about Kobes career in the data story as well. I will keep basketball as part of my life and try to incorporate in to my data journey wherever I can. Thanks for tuning in.
Mamba out!

References
Kobe Bryant stats, height, weight, position, draft status and more. Basketball. (n.d.). Retrieved February 16, 2023, from https://www.basketball-reference.com/players/b/bryanko01.html
Players. Official NBA Stats | Stats | NBA.com. (n.d.). Retrieved February 16, 2023, from https://www.nba.com/stats